Data projects
Datasets, dashboards and charts I build in my own time, with the code public. Click through: the dashboard is live.
Coke Studio Bangla: YouTube metrics, updated daily
2026
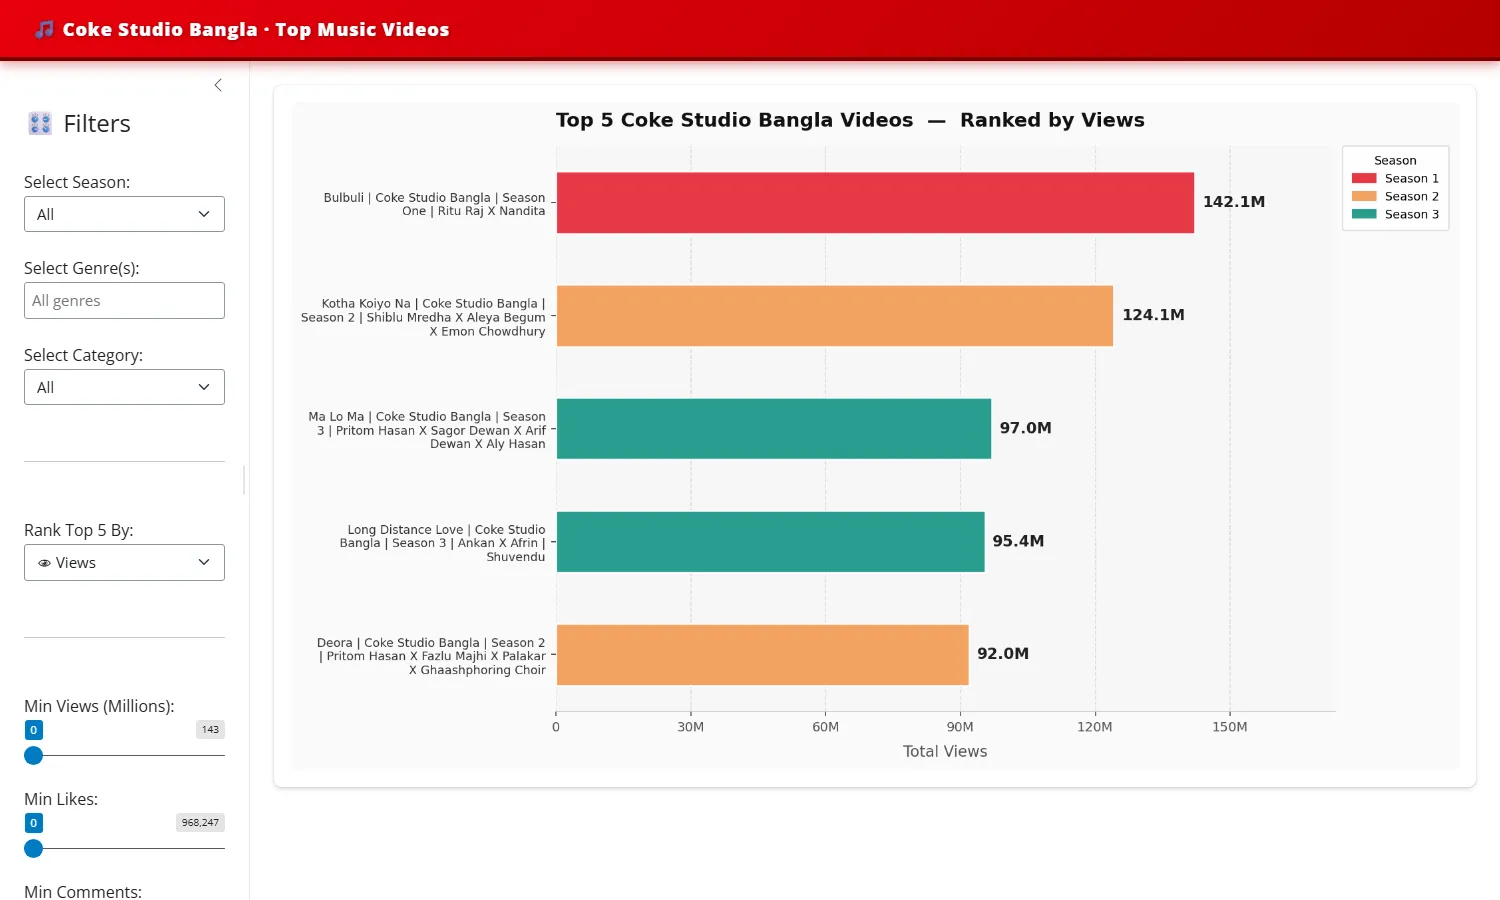
A Python pipeline pulls statistics for every video on the Coke Studio Bangla channel from the YouTube Data API, classifies each one by type, season and genre, parses singer and director credits, translates titles to English, and publishes the result as a Kaggle dataset that a scheduled notebook refreshes every day. A Shiny for Python dashboard downloads the latest version on start-up and ranks the top videos by views, likes or comments.
#30DayChartChallenge 2026: public health in charts
Apr 2026
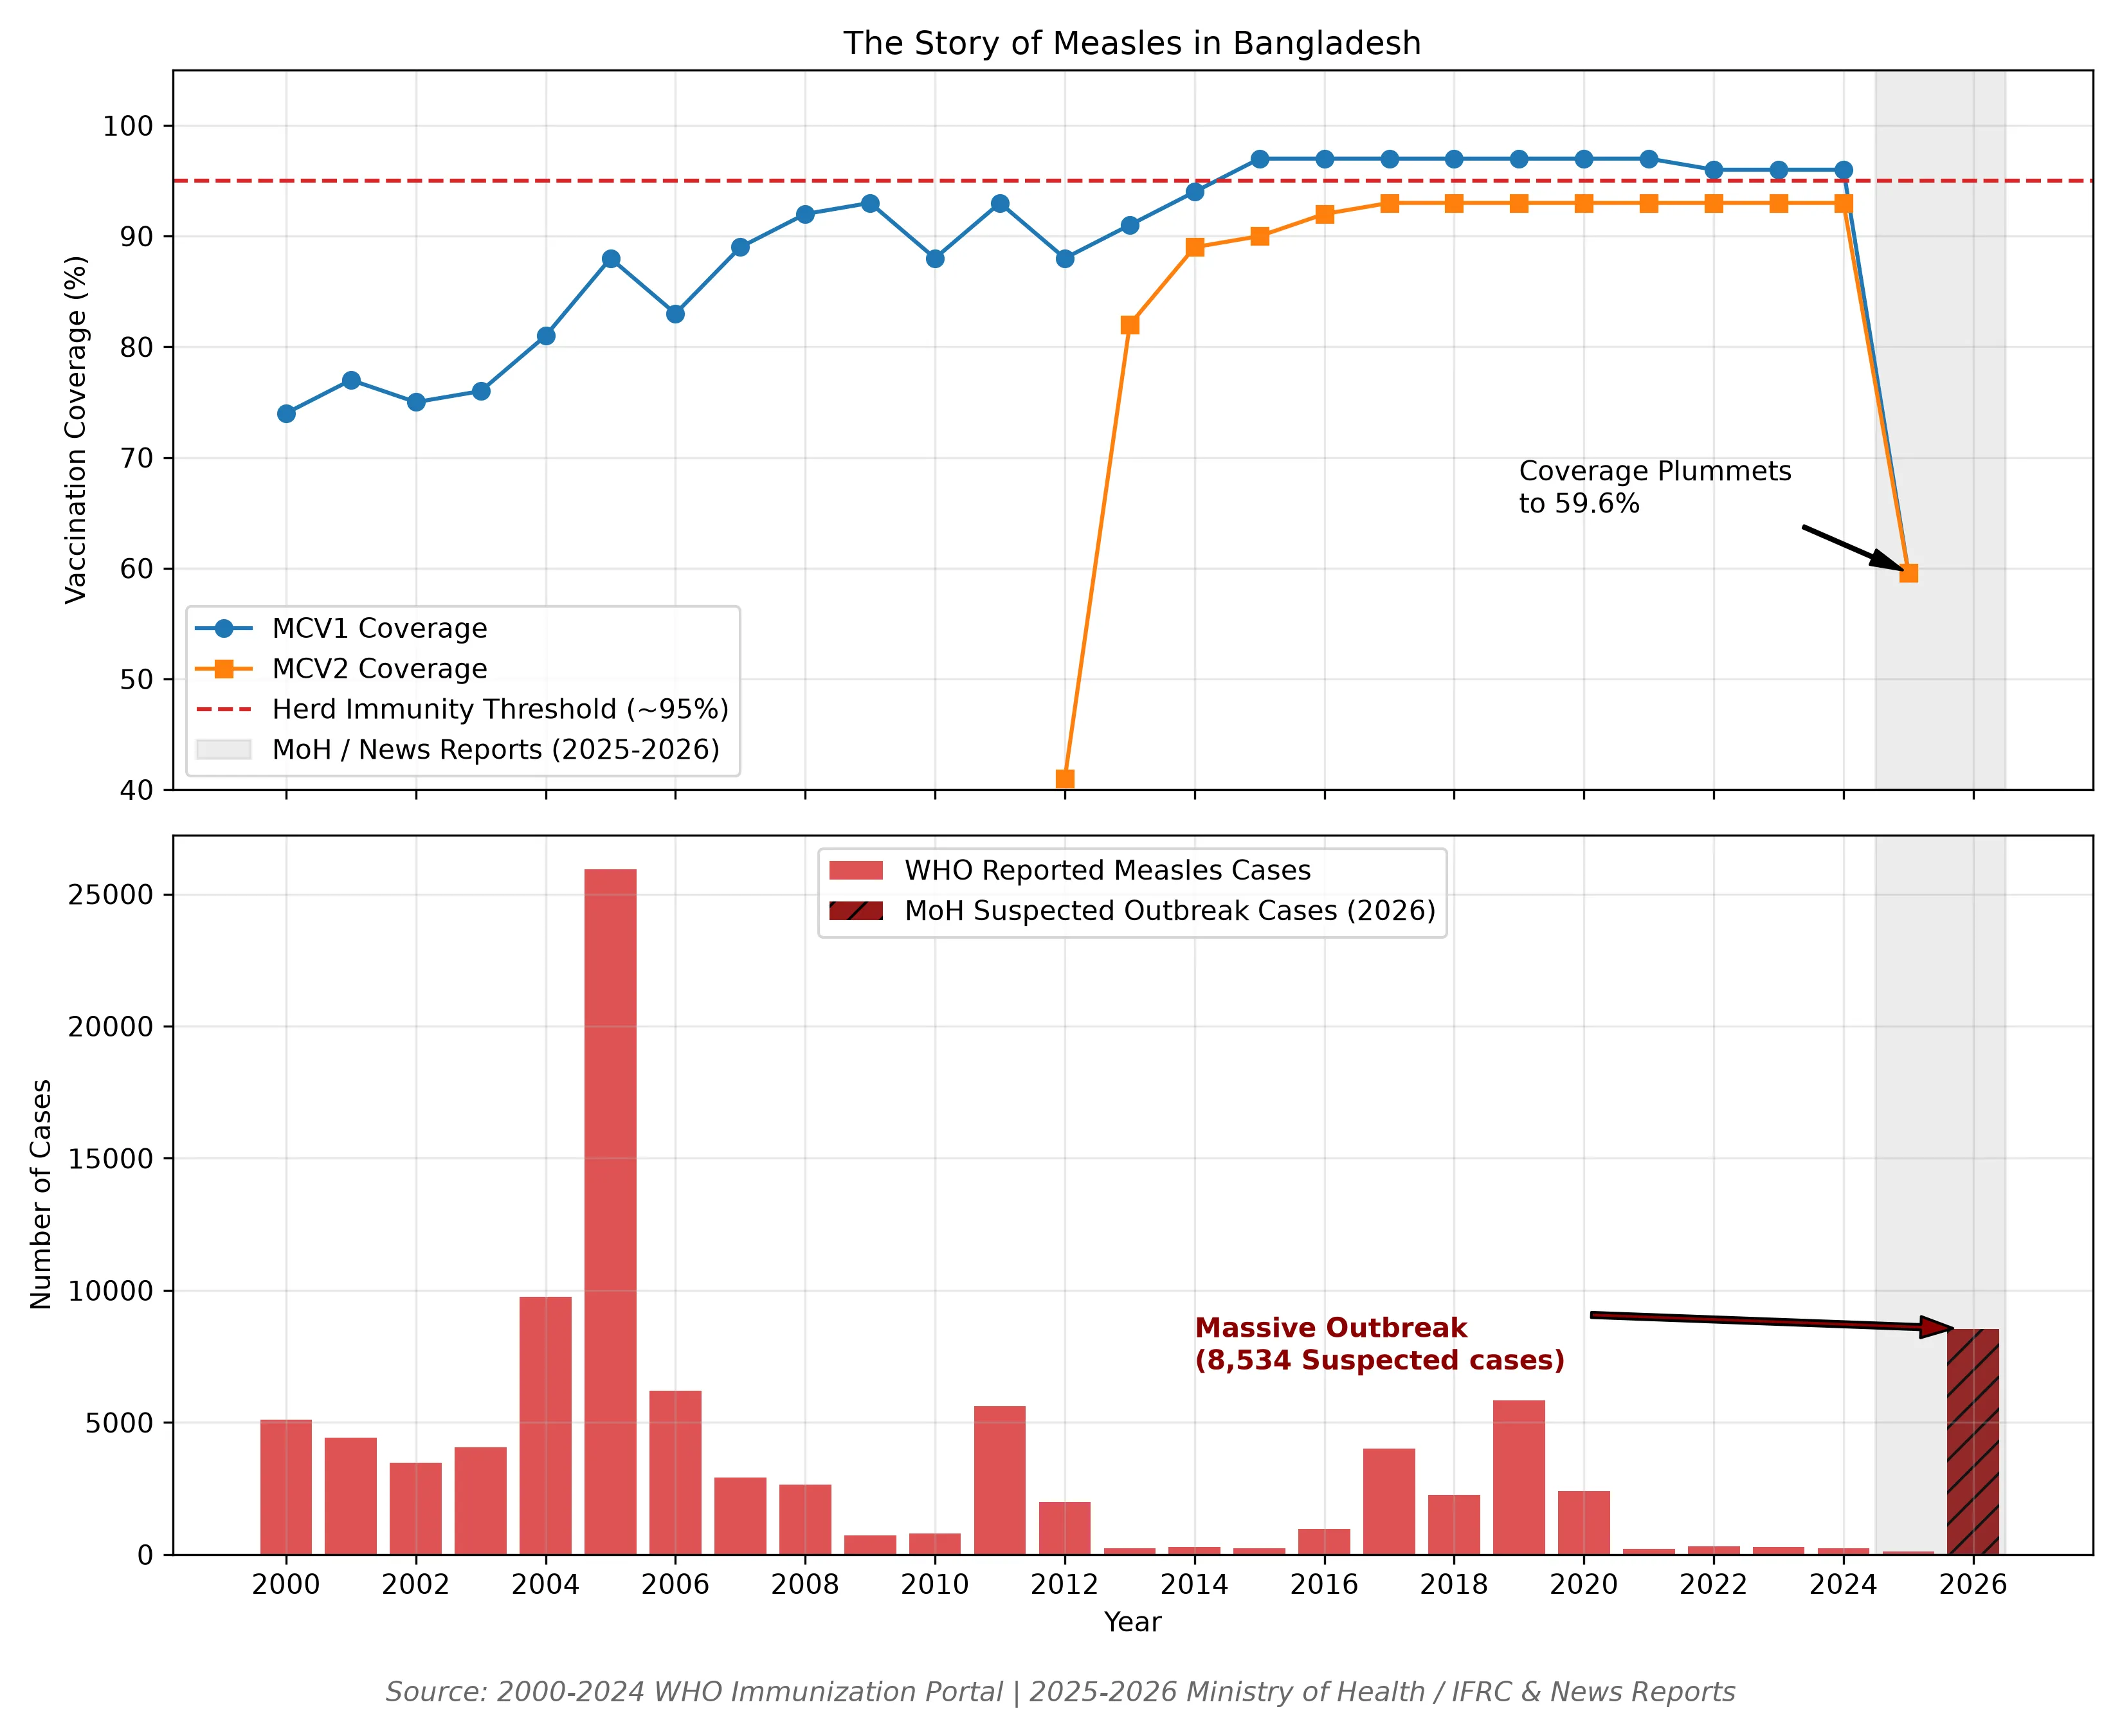
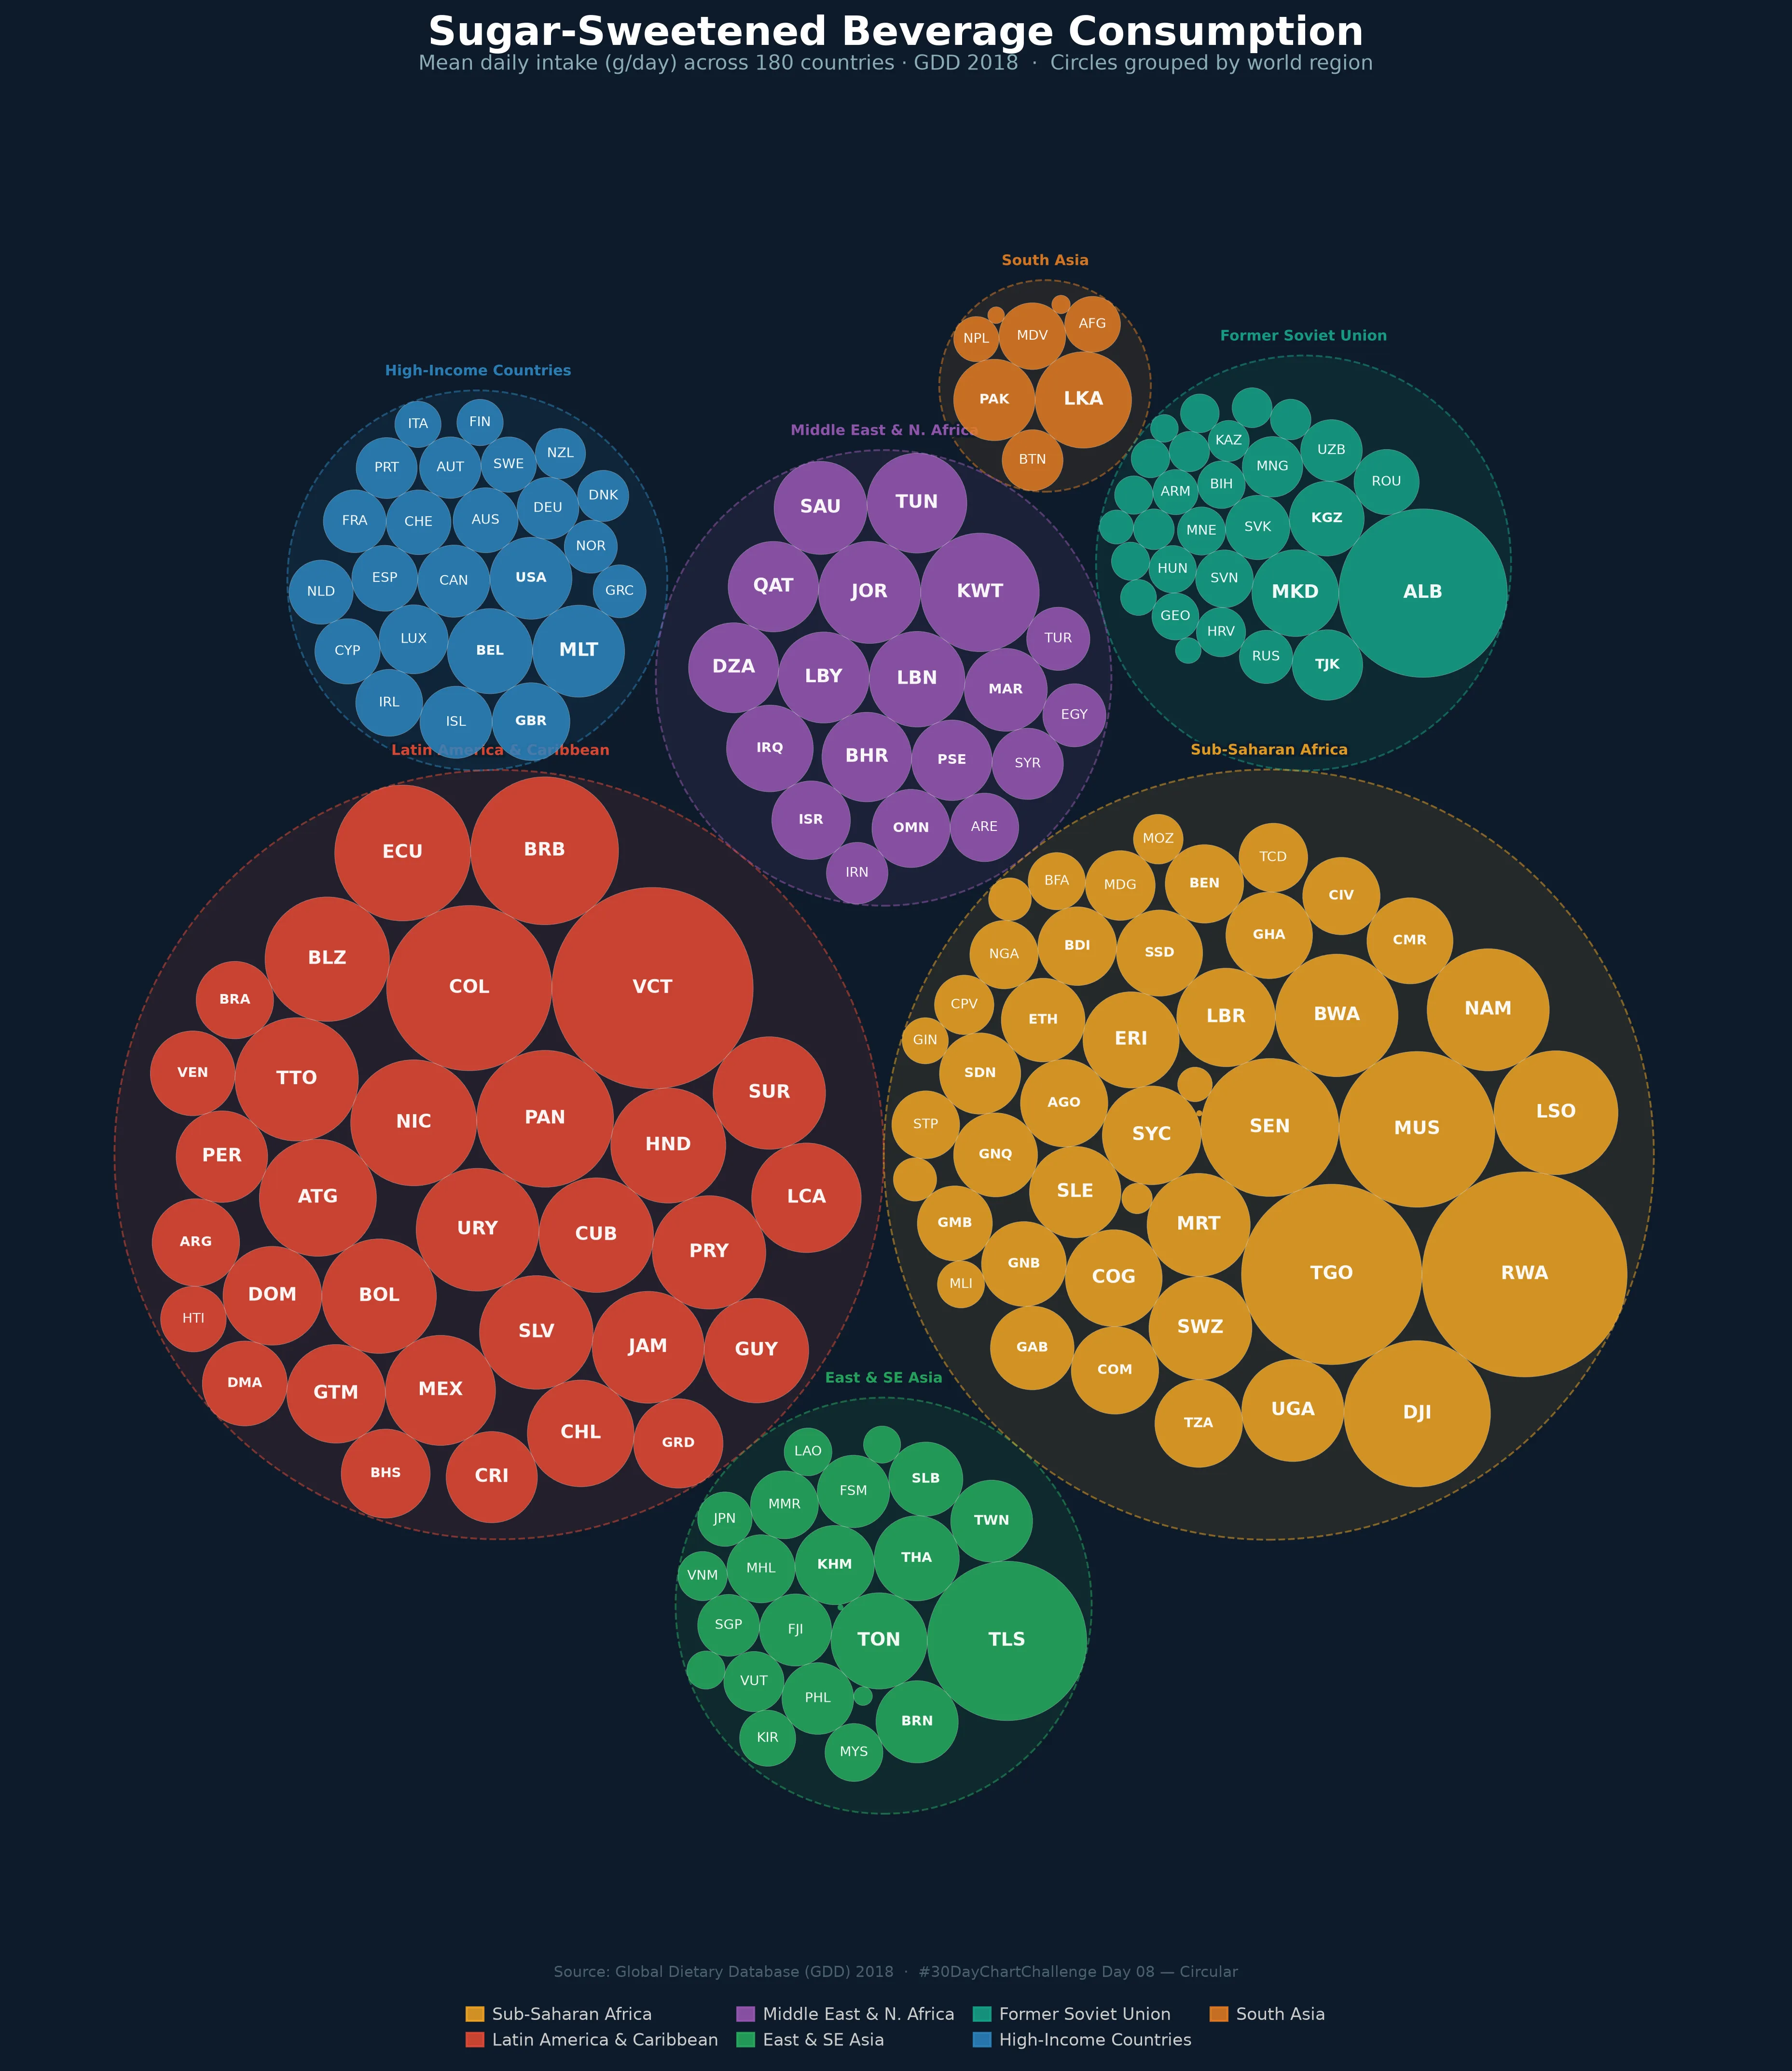
Nine charts for the April chart challenge, most written twice, once in Python and once in R, and most placing Bangladesh against other countries: out-of-pocket spending against UHC coverage, healthy life expectancy, child malnutrition, the doctor and nurse gap, tuberculosis incidence, measles vaccination and outbreaks, sugar-sweetened beverage intake, and regional wealth shares. Data from WHO World Health Statistics, the Global Dietary Database and the World Inequality Database.
- Day 1Out-of-pocket spending against UHC coverage
- Day 2Life expectancy against healthy life expectancy
- Day 3Malnutrition among children under five
- Day 4The healthcare workforce gap: doctors and nurses
- Day 5Tuberculosis incidence, mapped
- Day 6Mammal sleep by diet
- Day 7Measles in Bangladesh: coverage against outbreaks
- Day 8Sugar-sweetened beverage intake by world region
- Day 9Regional wealth shares, with Bangladesh in context